This article introduces our recent whitepaper “Record market data spend highlights need to track costs” which explores the growing value of market data, the drivers behind growth and complexity, how financial institutions can get an edge, what is involved in managing cost creep, how firms can optimize market data spend and usage, and why managers need more time to drive business value.
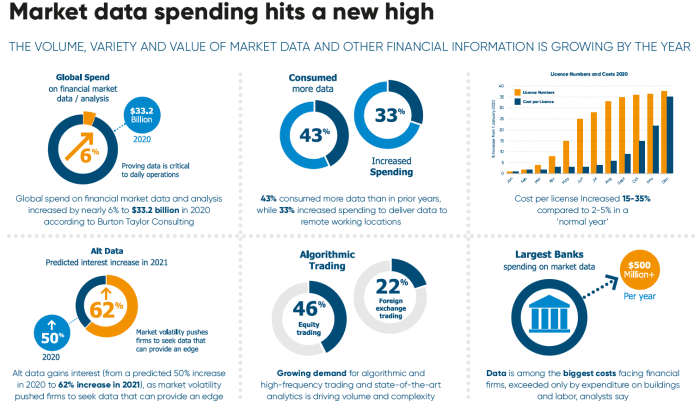
Market data spend hits a new record
Expenditure on market data hit a new record in 2020 as pandemic-induced volatility boosted demand for data and a surge in remote working saw requests for individual licenses rocket and their costs grow more than usual. The signs are that there will be no let-up in spending this year either. (EDIT: two in three survey respondents to Burton-Taylor’s annual market data survey estimate industry growth in 2022 to be greater than the 5-year average of 4.6%!)
With market data the life-blood of today’s trading, financial institutions large and small are under pressure to optimize what they spend and how. This wouldn’t be the first time that data managers have been asked to make savings, but now they face additional challenges.
 (Click image to enlarge)
Additional challenges data managers face
Consider just two: by all accounts, alt (short for alternative) data from non-traditional sources will become more important and command a bigger share of annual spending. These new sources and vendors will have to be evaluated.
Then there are those extra licenses for users working from home. With the biggest institutions already subscribing to thousands of licenses from hundreds of vendors, couldn’t this proliferation potentially make it harder for managers to track compliance with vendor contracts? A failure here could lead to a fine or a time-consuming audit.
Core tasks
Licensing and compliance are core tasks of managing market data inventory. Beyond the core, though, are numerous vital functions from paying invoices, through cataloguing data sets, to renewing contracts when they come due. These also have to be managed, and if something goes awry in any of these areas, efficiency drops and costs can rise.
The good news is that help is at hand.
Market data is part of the expanding subscription economy and TRG Screen, with more than 20 years experience, is the market leader in enterprise data subscription management services. TRG Screen is phasing in a brand-new platform that will handle all aspects of market data management across the entire lifecycle of a subscription.
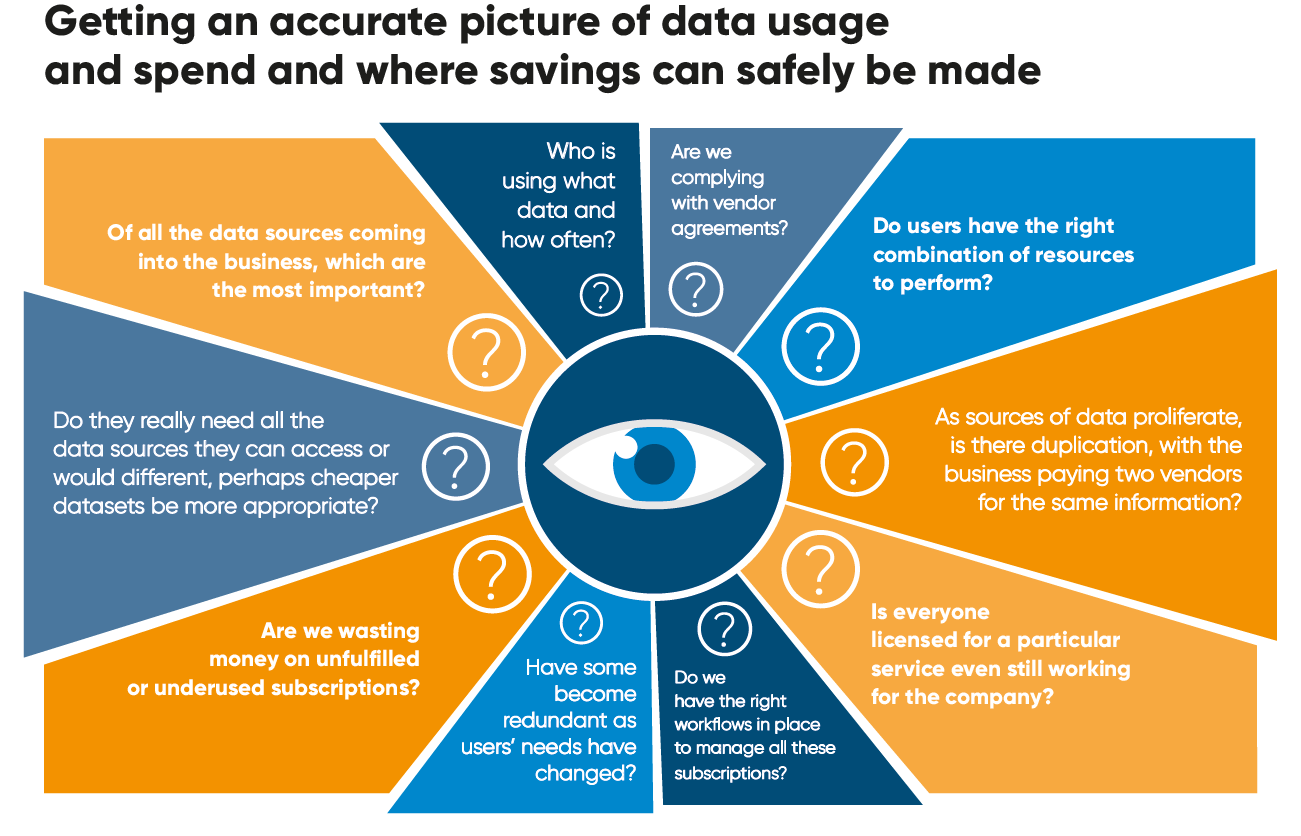
The new platform is Optimize. It combines the best of TRG Screen’s existing products with game changing new features to optimize data spend and usage and much besides. Industry insiders agree that a firm seeking to optimize its use of market data needs the full picture of its data landscape. Without that, there’s guesswork and “driving blind”.
Unparalleled Clarity
Optimize promises unparalleled clarity on all aspects of a data subscription for the whole story of a firm’s data landscape. But the new platform’s real gamechanger is Optimize insights. For the first time, data managers will be presented with actionable insights on where cost savings can be made and efficiency improved.
TRG Screen solutions can deliver rapid improvements in return on investment (ROI), with potential savings of 2-30 percent in the first year. It is clear that the data market will keep growing, as will the pressure to do more with less. The first step is for users to ensure they have the whole picture of their data subscriptions. That brings the insight needed to optimize consumption and make significant savings.
Want to learn how to get the whole picture of your data subscriptions?


 (Click image to enlarge)