Book a demo

Usage Monitoring Software for Online Subscriptions & Installed Applications

Get detailed per-user, per-service usage data for all your web-based subscriptions & installed applications

Companies are spending millions on web-based subscriptions, but how do you know if your firm is fully utilizing these valuable services? Wouldn’t it be great to have a usage report you can trust, instead of relying on vendor provided usage statistics?

Are your researchers and other users taking advantage of the subscriptions the firm has licensed already? Wouldn’t it help if you could extract detailed reports on an online subscription and see how effectively it can be used? Are you relying on inaccurate vendor provided data or manual surveys?

ResearchMonitor acts as your online resource usage monitoring software solution and is designed to empower you across these areas.

https://cdn2.hubspot.net/hubfs/4638111/images/usage-monitoring.png

Understanding the actual usage of online resources

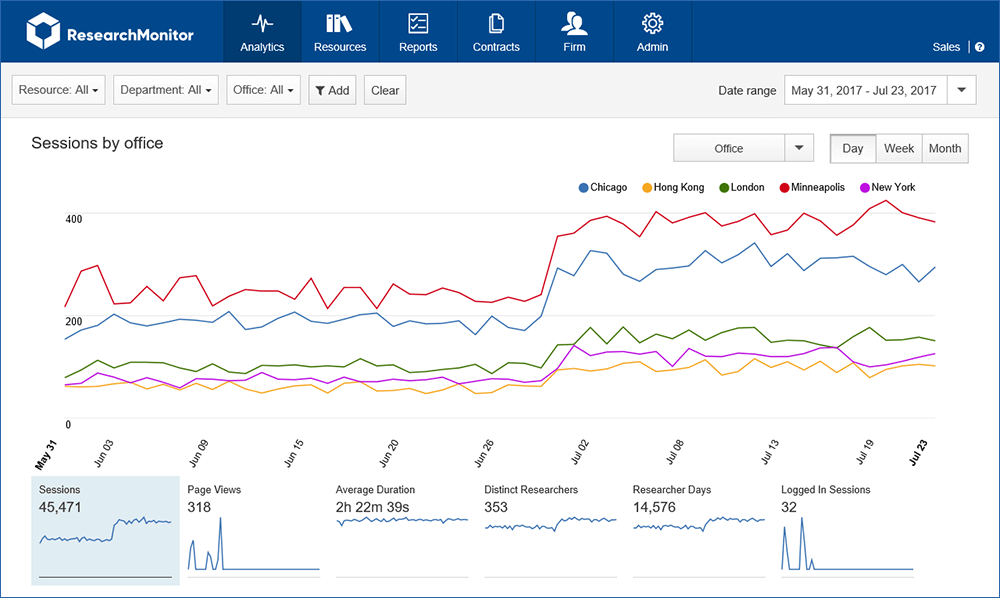
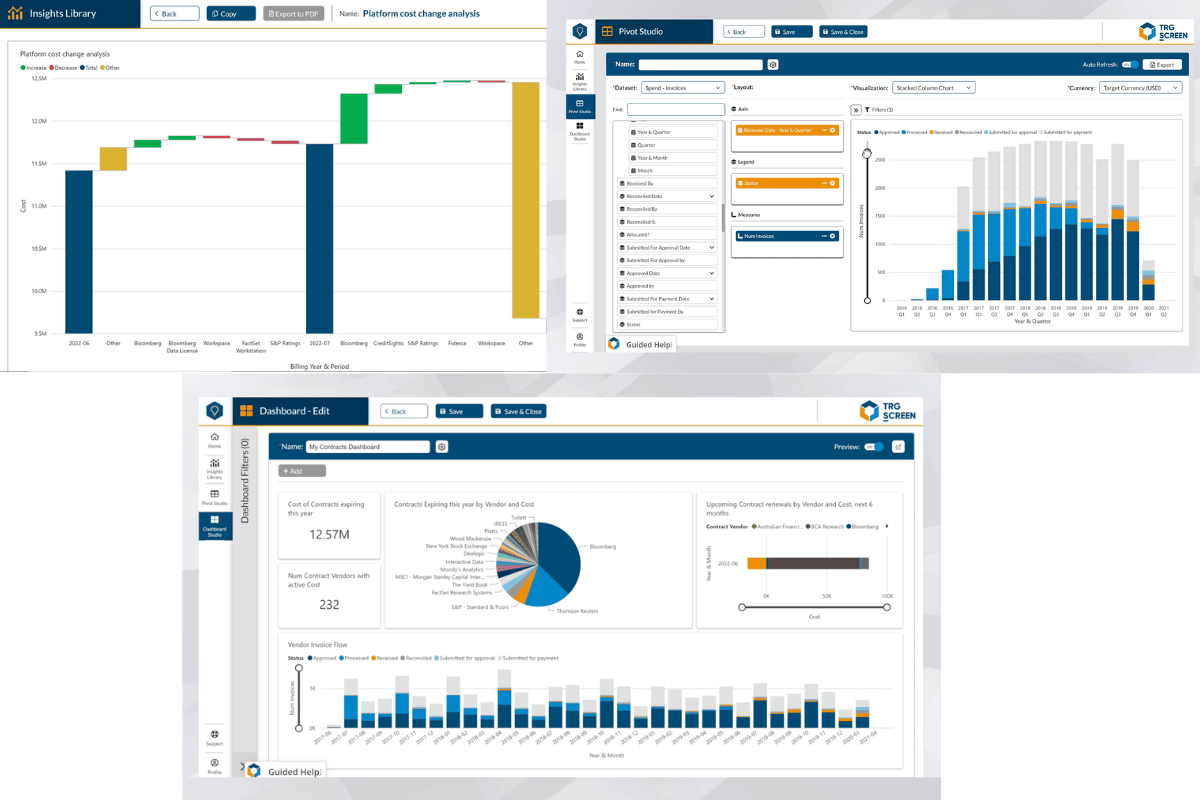
Visibility into the actual usage of online subscriptions — such as market data, research & SaaS licenses — as well as installed desktop applications (including terminals) is very important. Having a centrally controlled system where you can compare the basic usage between multiple vendors, provides you with valuable information at your fingertips.

Detailed usage statistics help you identify gaps in internal training & processes and categorize the sections of a subscription that are being heavily used. This helps you negotiate better contracts and allows you to streamline research & other information services workflows within your organization, driving operational efficiency across the board.

Your free flyer: ResearchMonitor

ResearchMonitor
usage-monitoring-software

Customized usage capturing

ResearchMonitor’s Usage Monitoring module helps you understand the value proposition of an online platform. Usage is captured at multiple detail levels, such as sessions, databases, search strings, and downloads. While every resource in ResearchMonitor is configured to monitor basic details — like start / end of session, duration, page views — it is also a platform to build on your individual requirements.

You might be specifically interested in recording search terms on one platform while on others you might be looking for the number of times users have downloaded a pdf or an Excel report. Another instance might be where you are just focused on the number of hits on a specific section of that website. This list is endless!

Ready to monitor the usage of your online subscriptions, installed applications & terminals?

Learn how you can optimize your usage management processes.

talk to an expert Download flyer

A single, centralized system for online resource usage monitoring

ResearchMonitor allows you to take control over these challenges by providing firms with a central system to analyze and control online market data, research & software subscriptions — independent of information vendors.

The architecture allows you to even track your intranet pages, allowing you a detailed reporting which your internal reporting might not be able to provide. ResearchMonitor also incorporates an Installed Application module that allows you to get basic usage data from installed desktop applications.

ResearchMonitor is supported across multiple browser types which means you do not miss out on any data capture. The system integrates with various third party HR & Finance systems to make reporting granular and customized to the level your firm understands.

ResearchMonitor data is available via an interactive dashboard, and an on-demand web reporting interface that allows you to create personalized bookmarks as well as scheduled reports making this a one stop solution for many firms.

optimize-insights-enterprise-subscription-management-reporting

Optimize Insights – Combines underlying data on spend and usage to provide tailored insights with powerful calls to action

ResearchMonitor is integrated into our Optimize Insights platform, which will let you benefit from key features including:

•    Insights Library: Specially curated library of story-based visualizations and dashboards
•    Dashboard Studio: Interactive dashboard designer allows users to create their own dashboards.
•    Pivot Studio: Intuitive web-based pivot table interface to manipulate underlying data with slice-and-dice drag-and-drop analytics and visualization capabilities.

Key takeaways

ResearchMonitor act as your central usage management system to analyze and control online market data, research & software subscriptions.

  • Right-size your underused subscriptions and extract more value for your end users
  • Negotiate with information vendors armed with accurate unbiased usage statistics
  • Reduce costs by terminating unutilized resources
  • Identify effectiveness of intranet design through usage behavior analysis targeting areas for future development
  • Prove department value through targeted resource usage management reports
  • Direct employees to preferred information providers based on search type and provider strategy
  • Seamlessly integrates with TRG Screen’s enterprise spend management software solution — Optimize Spend — to give you total visibility over both spend and usage to allow you to truly optimize your subscription expenditure
Contact Usage Monitoring

Get in touch

ResearchMonitor provides financial institutions, law firms, and professional services firms with a central system to manage and analyze all of your online subscriptions — such as market data, research & SaaS licenses — as well as installed desktop applications & terminals.

Usage tracking of web-based subscriptions & applications

Other processes ResearchMonitor optimizes

Key Benefits
  • Usage & trend analysis
  • Contract compliance
  • Access controls & user workflows