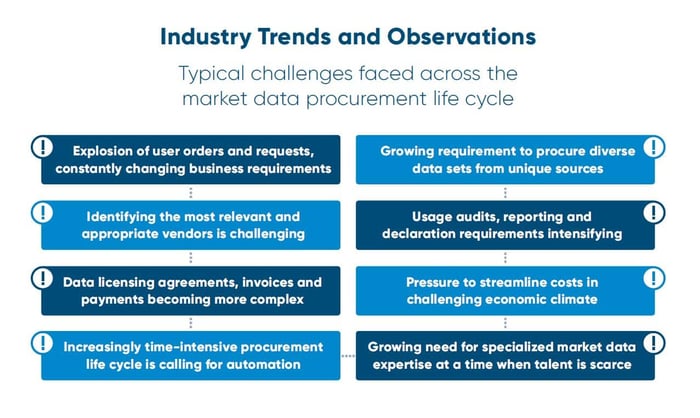
Market data spend hits another record 💰 as complexity grows

Spending on financial market data and news hit a new record in 2024, highlighting the value banks and other institution place on the these vital streams of information that drive their business.
“Market data remains one of the biggest costs faced by financial institutions .”
Global spend on financial market data rose by 6.4% on the previous year to $44.3 billion, with survey participants forecasting that it will exceed historical growth rates in 2024.
A respected annual report by Burton-Taylor International Consulting said spending has touched new highs every year for a decade.
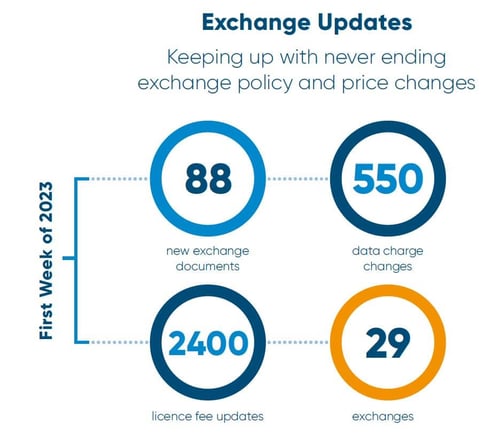
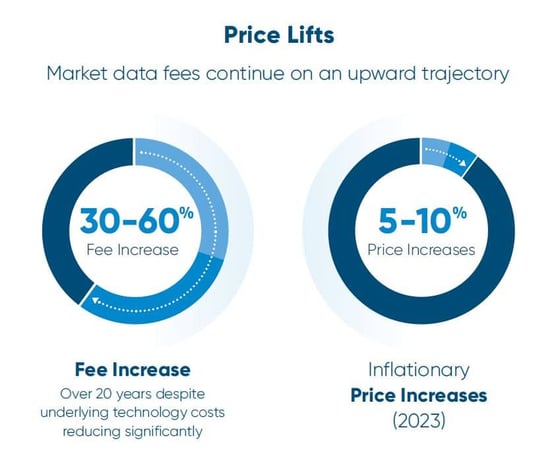
 It will come as no surprise to firms who are already having to pay more for data, that fees have risen by 30-60% in the past two decades and, driven by rampant global inflation, by 5-10% in 2023 alone. A contributing factor to the upward trend in spend.
Other growth factors
Like many other industries, market data consumers are arguably still dealing with the consequences of the pandemic. Market volatility during Covid and the economic upheaval that followed, fueled increased data demand. At the same time, what looks like a permanent shift to hybrid working meant firms needed more licenses, raising costs and potentially making it harder to track compliance with vendor contracts.
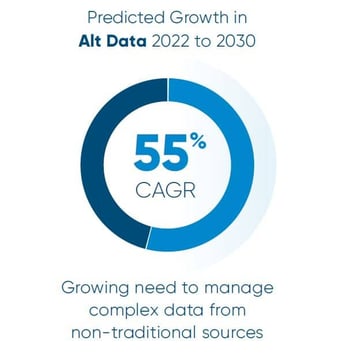
The increased demand for data triggered strong growth in alternative data, and it continues to expand. A report by San Francisco-based Grand View Research valued the global alternative data market at nearly $11.65 billion in 2024.
Analysts expect “alt-data” to undergo a compound annual growth rate of up to 55% between 2022 and 2030. This means more data sources need to be acquired and managed and typifies the relentless growth in complexity of market data.